The Landscape Marketing Index
First Half 2026
130+
74,096
−32.6%
−41.9%
Five findings worth acting on
Answer the phone.
Move budget earlier.
Split Search by service line.
Use LSA to fill schedules.
Invest in what you don’t buy.
Roughly one call in three never reaches a person.
Organic brings the most leads. GBP and AI bring the biggest jobs.
| Channel | Share of leads | Quotable rate | Prior year | Avg quote |
|---|---|---|---|---|
| Google organic | 28.2% | 32.2% | 32.5% | $21,191 |
| Direct | 16.3% | 23.8% | 27.1% | $15,814 |
| Performance Max | 15.1% | 28.5% | 21.0% | $22,507 |
| Search (paid) | 12.8% | 34.0% | 33.2% | $17,475 |
| LSA (US only) | 8.0% | 34.3% | 29.8% | $5,249 |
| Referral and other | 7.8% | 34.4% | 31.7% | $13,895 |
| Other search engines | 5.4% | 29.7% | 31.4% | $19,068 |
| Google Business Profile | 4.8% | 26.4% | 23.7% | $24,742 |
| Social | 1.1% | 19.4% | 25.7% | $14,365* |
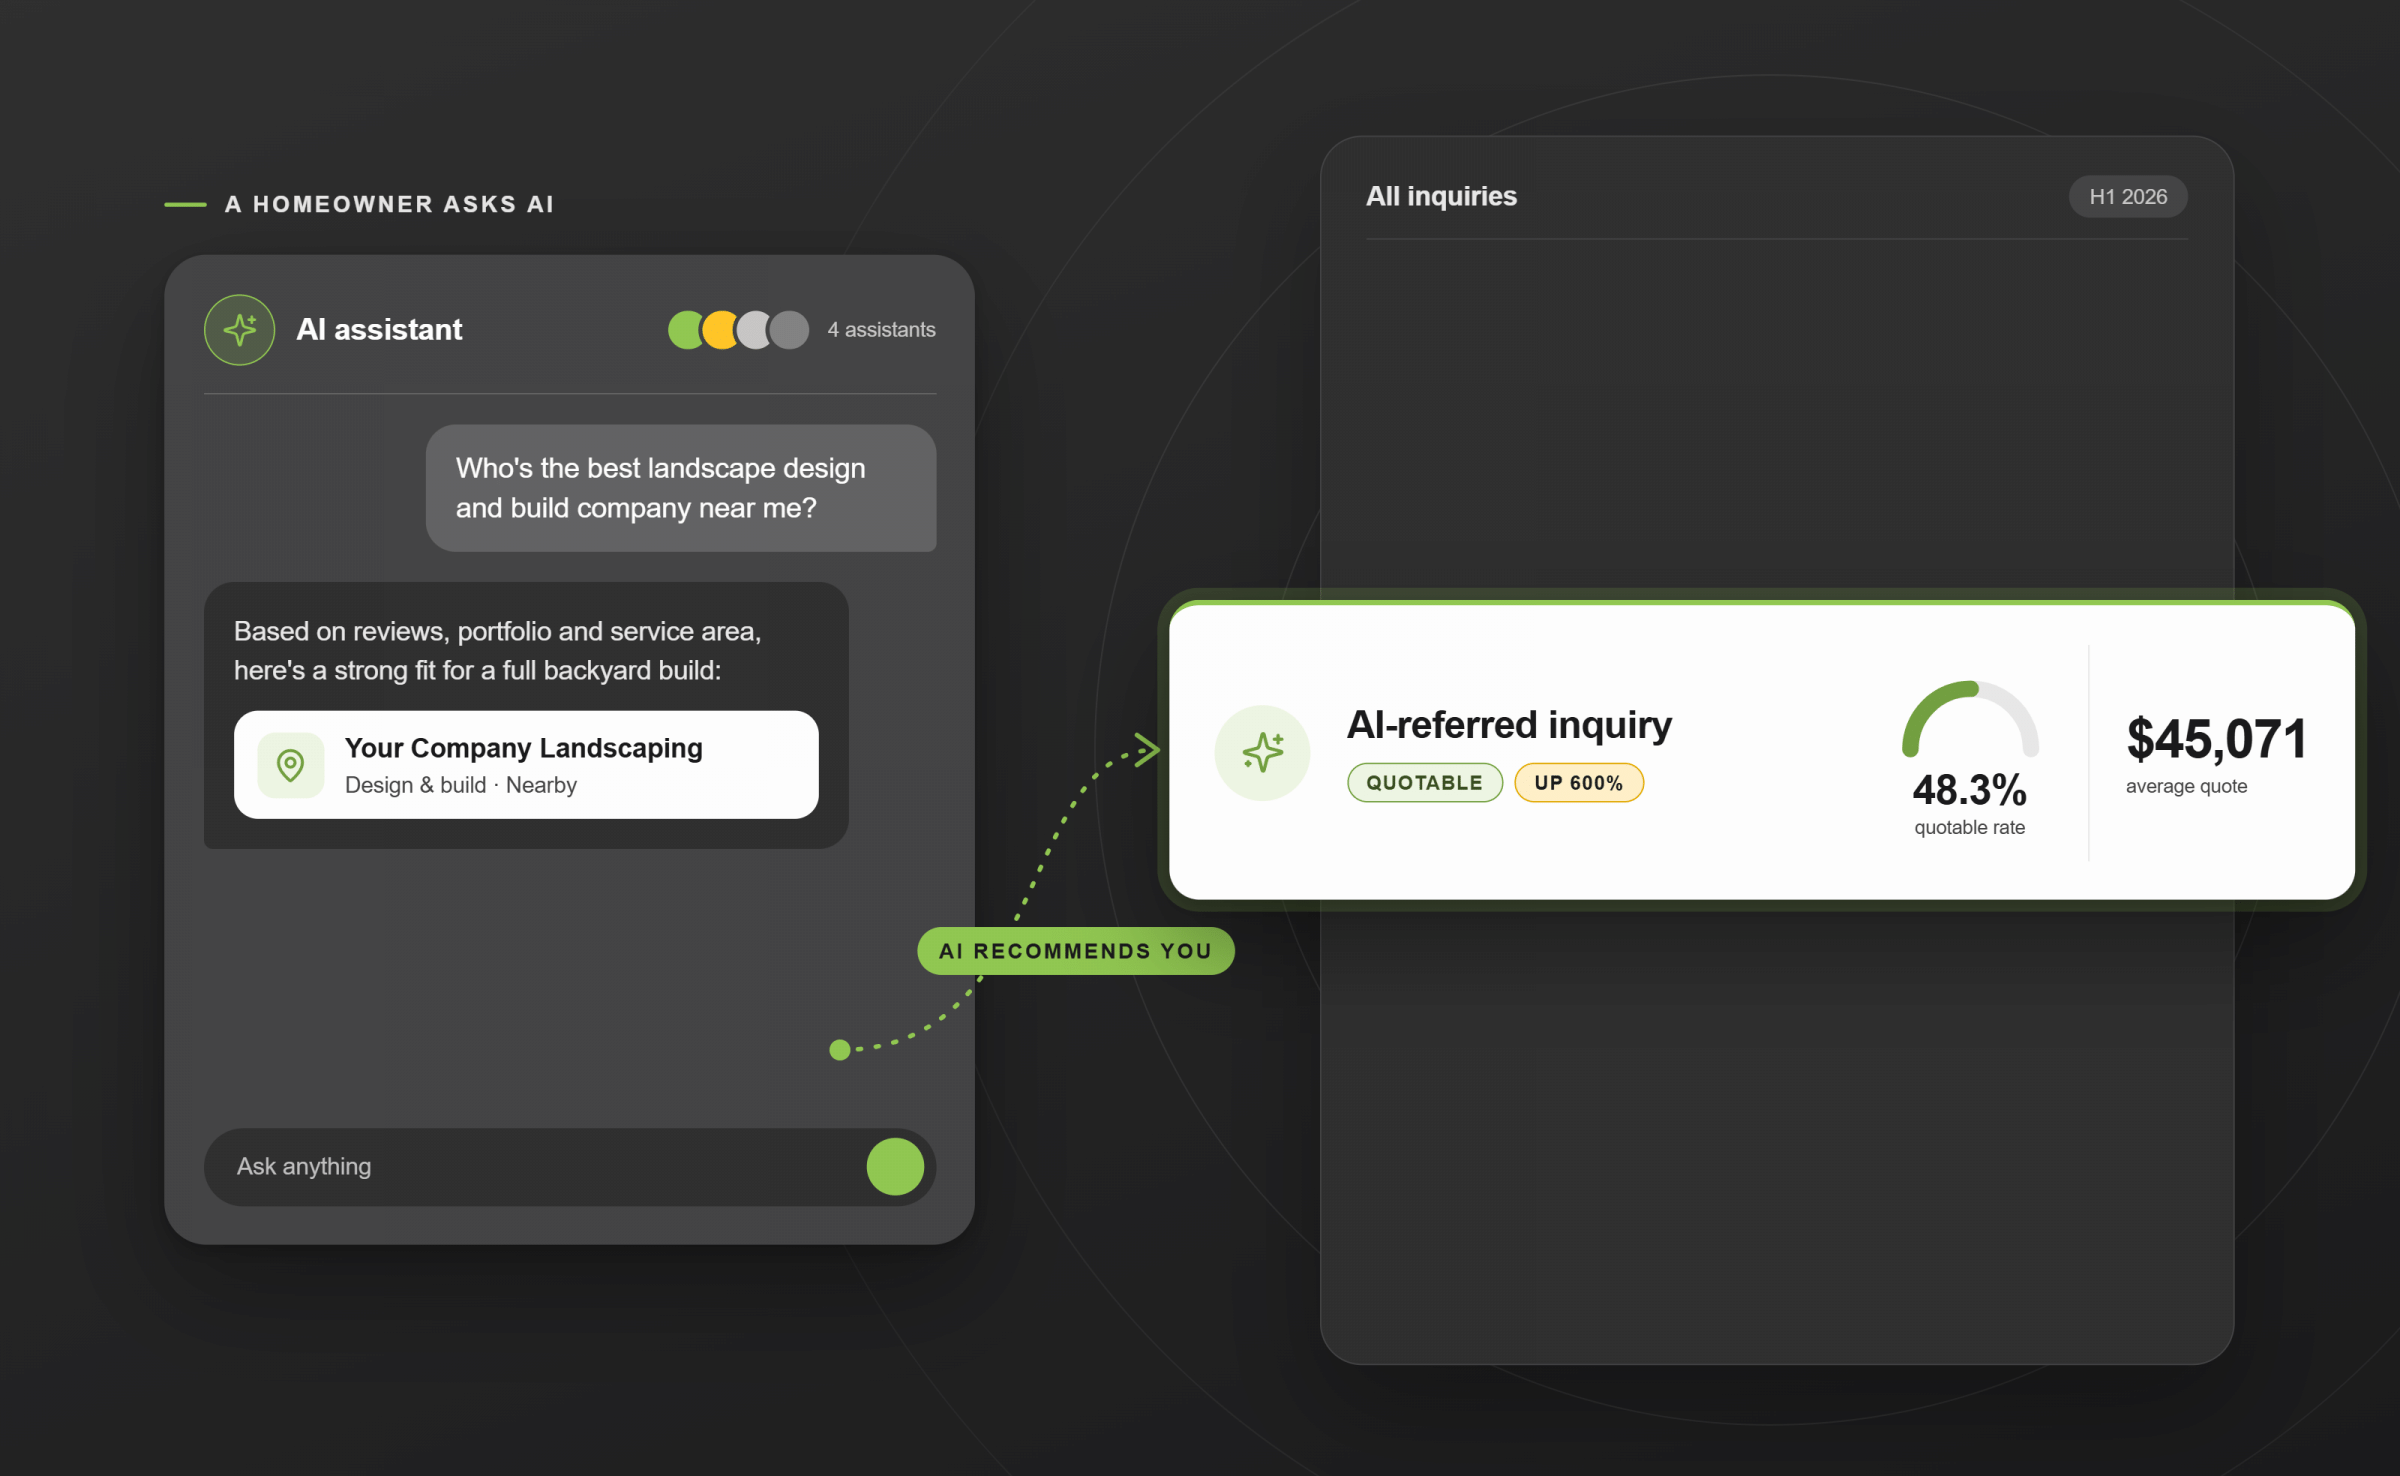
| AI assistants | 0.5% | 48.3% | 31.4% | $45,071 |
Value peaks before volume.
Qualification improved faster than media inflated.
| Metric | Design & build | Prior year | Maintenance | Prior year |
|---|---|---|---|---|
| Lead-to-quotable | 49.2% | 30.2% | 55.5% | 39.1% |
| Cost per quotable lead | $279.61 | $414.70 | $211.12 | $363.16 |
| Cost per lead | $137.60 | $125.36 | $117.08 | $141.93 |
| Cost per click | $2.91 | $2.36 | $2.86 | $3.09 |
| Click-through rate | 2.62% | 3.17% | 2.69% | 3.98% |
| Conversion rate | 2.12% | 1.87% | 2.44% | 2.17% |
| Unique leads | 3,674 | 2,362 | 1,722 | 783 |
Cost per lead alone gives the wrong answer.
AI-referred leads are few. They’re also the best in the index.